HomeDescriptive StatisticsHow to Choose the...

How to Choose the Best Measure of Central Tendency for Your Data: Mean vs. Median vs. Mode

When analyzing data, understanding the central tendency is crucial for drawing meaningful conclusions. Central tendency measures—mean, median, and mode—summarize a set of data by identifying the central point within that dataset. However, choosing the right measure can be challenging. This article will help you understand when to use the mean, median, or mode to best represent your data.

What is Central Tendency?

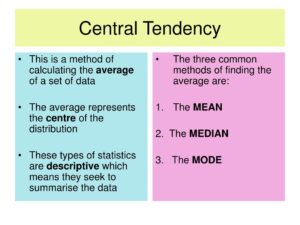
Central tendency refers to the middle or center of a data distribution. It provides an overall summary and can help in making comparisons between different datasets. The three main measures of central tendency are:

  1. Mean: The arithmetic average of a dataset.
  2. Median: The middle value that separates the higher half from the lower half.
  3. Mode: The most frequently occurring value in a dataset.

Each measure has its strengths and weaknesses, making it important to choose the one that best fits your data characteristics.

Mean: Pros and Cons

What is the Mean?

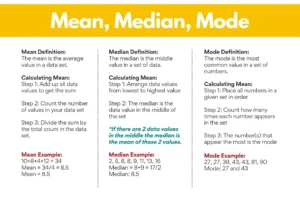
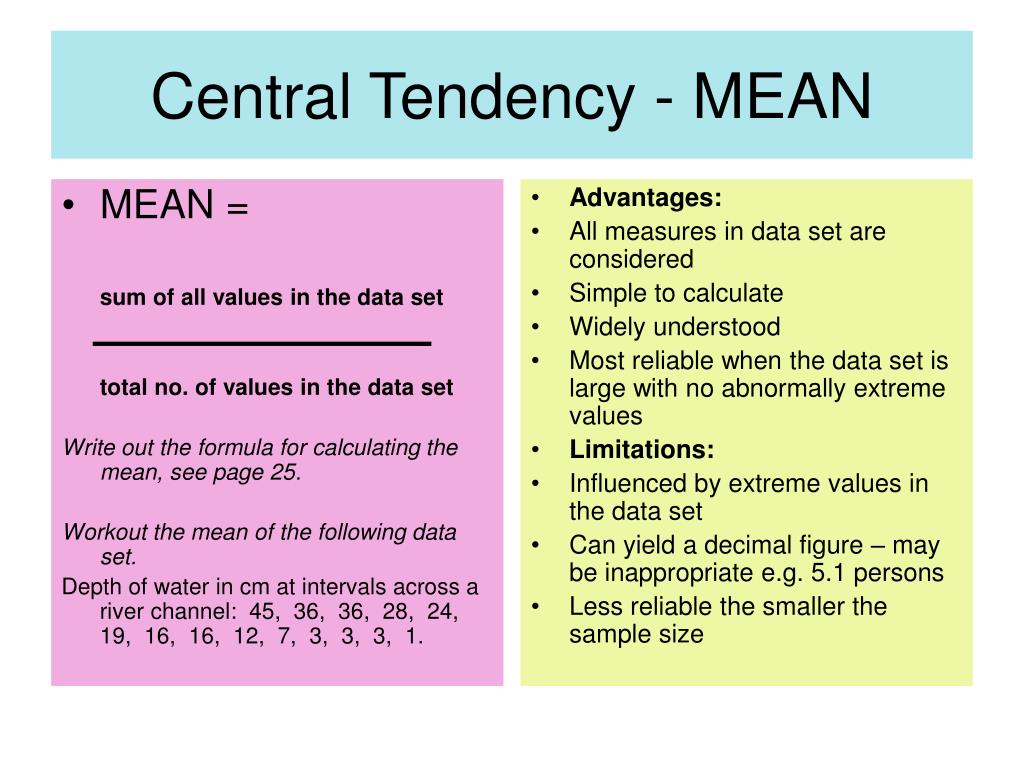
The mean is calculated by summing all the values in a dataset and dividing by the number of values. It is widely used in many fields because it takes into account all data points.

Pros of Using the Mean

  1. Simplicity: Easy to calculate and understand.
  2. Comprehensive: Incorporates all data points, providing a detailed summary.
  3. Mathematically Useful: Suitable for further statistical analysis and calculations.

Cons of Using the Mean

  1. Sensitive to Outliers: Extreme values can distort the mean, making it unrepresentative of the dataset.
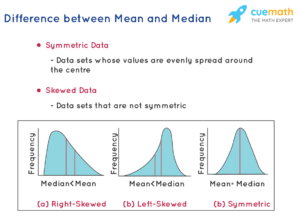
  2. Not Suitable for Skewed Distributions: In datasets with skewness, the mean may not accurately reflect the central tendency.

When to Use the Mean

The mean is best used when:

  • The data is symmetrically distributed without outliers.
  • You need a measure that includes all data points.
  • Further statistical analysis is required.

Median: Pros and Cons
What is the Median?

The median is the middle value of a dataset when it is ordered from least to greatest. If the dataset has an even number of observations, the median is the average of the two middle numbers.

Pros of Using the Median

  1. Robust to Outliers: Not affected by extreme values.
  2. Reflects Skewed Distributions: Provides a better central tendency for skewed datasets.
  3. Simple to Determine: Especially for small datasets.

Cons of Using the Median

  1. Ignores Extremes: Does not take into account all values, which might lead to loss of information.
  2. Less Useful for Further Analysis: Not as mathematically tractable as the mean.

When to Use the Median

The median is ideal when:

  • The dataset has outliers or is skewed.
  • You need a measure that is not influenced by extreme values.
  • The data is ordinal, meaning it has a meaningful order but not a uniform scale.

Mode: Pros and Cons

What is the Mode?

The mode is the value that appears most frequently in a dataset. A dataset can have more than one mode if multiple values have the same frequency.

Pros of Using the Mode

  1. Identifies Common Values: Shows the most frequent values in a dataset.
  2. Applicable to Categorical Data: Useful for qualitative data where mean and median cannot be applied.
  3. Unaffected by Outliers: Extreme values do not influence the mode.

Cons of Using the Mode

  1. Not Always Unique: Multiple modes can complicate the interpretation.
  2. May Not Reflect Central Tendency: In some datasets, the mode may not represent the data’s central point.

When to Use the Mode

The mode is best utilized when:

  • The data is categorical or nominal.
  • You are interested in the most common value.
  • There are multiple peaks in the data distribution.

Choosing the Best Measure for Your Data
Step-by-Step Guide

  1. Understand Your Data: Determine the type of data (nominal, ordinal, interval, ratio) and look for outliers and skewness.
  2. Analyze Distribution: Plot the data to visualize its distribution. Check for symmetry and outliers.
  3. Compare Measures: Calculate the mean, median, and mode. Compare how they represent your data.
  4. Consider Purpose: Think about your analysis goals. Do you need a robust measure against outliers (median), or a mathematically useful measure (mean), or the most frequent observation (mode)?

Practical Examples

  1. House Prices: When analyzing house prices, the median is often preferred due to the presence of extreme values (e.g., very high or very low prices).
  2. Test Scores: In education, the mean is commonly used to calculate average scores unless the data is highly skewed or contains outliers.
  3. Customer Preferences: For categorical data like customer preferences or survey responses, the mode is most appropriate.

Conclusion

Choosing the best measure of central tendency depends on the nature of your data and the specific context of your analysis. The mean is useful for symmetrical data without outliers, the median is robust for skewed data, and the mode is ideal for categorical data. By understanding the strengths and weaknesses of each measure, you can select the most appropriate one to accurately represent your dataset.

- A word from our sponsors -

spot_img

Most Popular

LEAVE A REPLY

Please enter your comment!
Please enter your name here

More from Author

The Future of Data Visualization: Emerging Techniques to Watch in 2024

In an era dominated by information overload, effective data visualization has...

Why Confidence Intervals Are Crucial for Medical Research: Insights for 2024

Confidence intervals (CIs) are a vital component of statistical analysis, especially...

Mastering Measures of Dispersion: A Comprehensive Guide for Data Scientists in 2024

  In the world of data science, understanding how data varies is...

Mastering R Programming for Advanced Statistical Analysis: Top Techniques and Tools for 2024

In the ever-evolving world of data science, R programming stands out...

- A word from our sponsors -

spot_img

Read Now

The Future of Data Visualization: Emerging Techniques to Watch in 2024

In an era dominated by information overload, effective data visualization has emerged as a crucial tool for communication and decision-making. As we move into 2024, the landscape of data visualization is evolving rapidly, fueled by advancements in technology, the rise of big data, and an increased emphasis...

Why Confidence Intervals Are Crucial for Medical Research: Insights for 2024

Confidence intervals (CIs) are a vital component of statistical analysis, especially in medical research. They provide a range of values that help researchers determine the reliability and precision of study results. In 2024, as medical research continues to evolve with advancements in technology and data collection, the...

Mastering Measures of Dispersion: A Comprehensive Guide for Data Scientists in 2024

  In the world of data science, understanding how data varies is crucial for making informed decisions and drawing accurate conclusions. Measures of dispersion, also known as measures of variability, provide insights into the spread and variability of data points within a dataset. This comprehensive guide will explore...

Mastering R Programming for Advanced Statistical Analysis: Top Techniques and Tools for 2024

In the ever-evolving world of data science, R programming stands out as a robust tool for advanced statistical analysis. With its rich ecosystem of packages and powerful capabilities, R continues to be a top choice for statisticians, data analysts, and researchers. As we move into 2024, mastering...

Understanding Probability Distributions: Key Concepts and Their Applications in Data Science

In the realm of data science, understanding probability distributions is fundamental to analyzing and interpreting data. These distributions provide insights into the variability and likelihood of different outcomes, enabling data scientists to make informed decisions and predictions. This article delves into key concepts of probability distributions and...

Mastering Linear Regression Models in 2024: Advanced Techniques and Best Practices for Accurate Predictions

In 2024, linear regression continues to be a cornerstone technique in data science and predictive analytics. Its simplicity, interpretability, and effectiveness make it an essential tool for professionals seeking to model relationships between variables and make informed predictions. This article explores advanced techniques and best practices for...

Mastering Hypothesis Testing: The Latest Techniques and Trends for Data Analysis in 2024

In the ever-evolving world of data analysis, hypothesis testing remains a cornerstone for drawing meaningful conclusions from empirical data. As we navigate through 2024, advancements in technology and methodology continue to reshape how we approach and execute hypothesis testing. This comprehensive guide explores the latest techniques and...

Top 5 Practical Uses of Measures of Central Tendency in Modern Statistical Analysis

  In modern statistical analysis, measures of central tendency are foundational tools used to summarize and interpret data sets. These measures—mean, median, and mode—provide insights into the central point around which data values cluster. Understanding their practical applications is crucial for data-driven decision-making across various fields. This article...

Mastering Measures of Central Tendency: Essential Techniques and Trends for Accurate Data Analysis in 2024

In the realm of data analysis, mastering measures of central tendency is fundamental for extracting meaningful insights from complex datasets. As we advance into 2024, the importance of understanding these measures—mean, median, and mode—cannot be overstated. This article explores essential techniques and emerging trends to ensure accurate...

Top Statistical Software for 2024: A Comprehensive Comparison of Leading Tools

In the rapidly evolving world of data analysis, selecting the right statistical software is crucial for obtaining accurate results and making informed decisions. As we move into 2024, the landscape of statistical software is more dynamic than ever, with new tools and updates enhancing data analysis capabilities....

Top Statistical Software of 2024: A Comprehensive Comparison of Leading Tools for Data Analysis

In the ever-evolving world of data analysis, selecting the right statistical software is crucial for achieving accurate insights and informed decision-making. As we approach the latter half of 2024, the landscape of statistical software continues to advance, offering a variety of powerful tools for data professionals. This...

How the Law of Large Numbers is Shaping Data Science Innovations in 2024

In the ever-evolving field of data science, foundational principles play a crucial role in driving innovation and shaping new methodologies. Among these principles, the Law of Large Numbers (LLN) stands out as a pivotal concept that continues to influence the development of data science techniques and technologies....