HomeRegression AnalysisUnlocking Data Insights: The...

Unlocking Data Insights: The Power of Linear Regression Models in Predictive Analytics

In the age of big data, businesses are increasingly relying on predictive analytics to make informed decisions. One of the most powerful tools in the predictive analytics toolbox is the linear regression model. This article explores how linear regression models unlock data insights and drive strategic decision-making in various industries.

Understanding Linear Regression

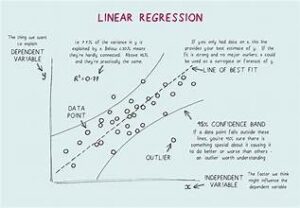
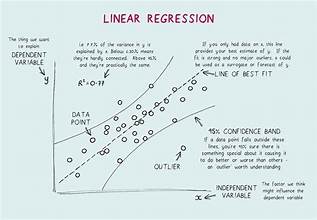
Linear regression is a statistical method used to model the relationship between a dependent variable and one or more independent variables. The primary objective is to predict the dependent variable based on the values of the independent variables. The relationship is modeled through a linear equation:

y=β0+β1×1+β2×2+…+βnxn+ϵy = \beta_0 + \beta_1x_1 + \beta_2x_2 + … + \beta_nx_n + \epsilon

Where:

  • yy is the dependent variable.
  • β0\beta_0 is the intercept.
  • β1,β2,…,βn\beta_1, \beta_2, …, \beta_n are the coefficients of the independent variables.
  • x1,x2,…,xnx_1, x_2, …, x_n are the independent variables.
  • ϵ\epsilon is the error term.

The Power of Linear Regression in Predictive Analytics
1. Simplicity and Interpretability

Linear regression models are straightforward and easy to interpret. The coefficients indicate the strength and direction of the relationship between each independent variable and the dependent variable. This simplicity makes linear regression an attractive choice for analysts and decision-makers who need clear and actionable insights.

2. Efficiency in Predictive Performance

Despite its simplicity, linear regression can be highly effective in predicting outcomes. It works well with linear relationships and can be extended to capture non-linear patterns using polynomial regression or interaction terms. For many applications, the predictive performance of linear regression is on par with more complex models.

3. Identifying Key Drivers

Linear regression helps identify the key drivers behind an outcome. By analyzing the coefficients, businesses can determine which factors significantly impact their metrics. This knowledge allows for targeted interventions and resource allocation, optimizing performance and efficiency.

4. Versatility Across Industries

Linear regression is used across various industries, from finance to healthcare. In finance, it can predict stock prices and assess credit risk. In healthcare, it helps in predicting patient outcomes and optimizing treatment plans. Its versatility makes it a go-to model for many predictive analytics tasks.

Building a Linear Regression Model: A Step-by-Step Guide

Step 1: Data Collection and Preparation

The first step in building a linear regression model is collecting and preparing the data. This involves:

  • Gathering relevant data: Ensure the data includes all potential independent variables.
  • Cleaning the data: Handle missing values, outliers, and inconsistencies.
  • Feature selection: Choose the most relevant variables to include in the model.

Step 2: Splitting the Data

Split the data into training and testing sets. The training set is used to build the model, while the testing set evaluates its performance. A common practice is to use 70-80% of the data for training and the remaining 20-30% for testing.

Step 3: Model Training

Train the linear regression model using the training data. This involves estimating the coefficients (β\beta) that minimize the difference between the predicted and actual values of the dependent variable.

Step 4: Model Evaluation

Evaluate the model’s performance using the testing data. Common metrics include:

  • R-squared: Measures the proportion of variance in the dependent variable explained by the independent variables.
  • Mean Squared Error (MSE): Calculates the average squared difference between predicted and actual values.
  • Root Mean Squared Error (RMSE): The square root of MSE, providing a measure in the same units as the dependent variable.

Step 5: Model Optimization

Optimize the model by tweaking parameters, adding interaction terms, or applying regularization techniques like Lasso or Ridge regression to prevent overfitting and improve predictive performance.

Real-World Applications of Linear Regression
1. Marketing and Sales

Linear regression models help marketers predict customer behavior, optimize pricing strategies, and improve campaign effectiveness. By understanding the factors that drive sales, businesses can tailor their marketing efforts to target the right audience at the right time.

2. Finance

In finance, linear regression is used to forecast economic indicators, predict stock prices, and assess credit risk. It enables financial institutions to make data-driven decisions, manage risk, and maximize returns.

3. Healthcare

Healthcare providers use linear regression to predict patient outcomes, optimize treatment plans, and allocate resources efficiently. By analyzing patient data, hospitals can improve care quality and reduce costs.

4. Manufacturing

Manufacturers apply linear regression to optimize production processes, forecast demand, and reduce waste. It helps in identifying the key factors affecting production efficiency and product quality.

Conclusion

Linear regression models are a cornerstone of predictive analytics, offering simplicity, interpretability, and versatility. By unlocking data insights, these models empower businesses to make informed decisions, optimize performance, and stay competitive in an increasingly data-driven world.

Implementing linear regression in your predictive analytics strategy can drive significant improvements across various domains. Embrace the power of linear regression and transform your data into actionable insights for sustained success.

- A word from our sponsors -

spot_img

Most Popular

LEAVE A REPLY

Please enter your comment!
Please enter your name here

More from Author

The Future of Data Visualization: Emerging Techniques to Watch in 2024

In an era dominated by information overload, effective data visualization has...

Why Confidence Intervals Are Crucial for Medical Research: Insights for 2024

Confidence intervals (CIs) are a vital component of statistical analysis, especially...

Mastering Measures of Dispersion: A Comprehensive Guide for Data Scientists in 2024

  In the world of data science, understanding how data varies is...

Mastering R Programming for Advanced Statistical Analysis: Top Techniques and Tools for 2024

In the ever-evolving world of data science, R programming stands out...

- A word from our sponsors -

spot_img

Read Now

The Future of Data Visualization: Emerging Techniques to Watch in 2024

In an era dominated by information overload, effective data visualization has emerged as a crucial tool for communication and decision-making. As we move into 2024, the landscape of data visualization is evolving rapidly, fueled by advancements in technology, the rise of big data, and an increased emphasis...

Why Confidence Intervals Are Crucial for Medical Research: Insights for 2024

Confidence intervals (CIs) are a vital component of statistical analysis, especially in medical research. They provide a range of values that help researchers determine the reliability and precision of study results. In 2024, as medical research continues to evolve with advancements in technology and data collection, the...

Mastering Measures of Dispersion: A Comprehensive Guide for Data Scientists in 2024

  In the world of data science, understanding how data varies is crucial for making informed decisions and drawing accurate conclusions. Measures of dispersion, also known as measures of variability, provide insights into the spread and variability of data points within a dataset. This comprehensive guide will explore...

Mastering R Programming for Advanced Statistical Analysis: Top Techniques and Tools for 2024

In the ever-evolving world of data science, R programming stands out as a robust tool for advanced statistical analysis. With its rich ecosystem of packages and powerful capabilities, R continues to be a top choice for statisticians, data analysts, and researchers. As we move into 2024, mastering...

Understanding Probability Distributions: Key Concepts and Their Applications in Data Science

In the realm of data science, understanding probability distributions is fundamental to analyzing and interpreting data. These distributions provide insights into the variability and likelihood of different outcomes, enabling data scientists to make informed decisions and predictions. This article delves into key concepts of probability distributions and...

Mastering Linear Regression Models in 2024: Advanced Techniques and Best Practices for Accurate Predictions

In 2024, linear regression continues to be a cornerstone technique in data science and predictive analytics. Its simplicity, interpretability, and effectiveness make it an essential tool for professionals seeking to model relationships between variables and make informed predictions. This article explores advanced techniques and best practices for...

Mastering Hypothesis Testing: The Latest Techniques and Trends for Data Analysis in 2024

In the ever-evolving world of data analysis, hypothesis testing remains a cornerstone for drawing meaningful conclusions from empirical data. As we navigate through 2024, advancements in technology and methodology continue to reshape how we approach and execute hypothesis testing. This comprehensive guide explores the latest techniques and...

Top 5 Practical Uses of Measures of Central Tendency in Modern Statistical Analysis

  In modern statistical analysis, measures of central tendency are foundational tools used to summarize and interpret data sets. These measures—mean, median, and mode—provide insights into the central point around which data values cluster. Understanding their practical applications is crucial for data-driven decision-making across various fields. This article...

Mastering Measures of Central Tendency: Essential Techniques and Trends for Accurate Data Analysis in 2024

In the realm of data analysis, mastering measures of central tendency is fundamental for extracting meaningful insights from complex datasets. As we advance into 2024, the importance of understanding these measures—mean, median, and mode—cannot be overstated. This article explores essential techniques and emerging trends to ensure accurate...

Top Statistical Software for 2024: A Comprehensive Comparison of Leading Tools

In the rapidly evolving world of data analysis, selecting the right statistical software is crucial for obtaining accurate results and making informed decisions. As we move into 2024, the landscape of statistical software is more dynamic than ever, with new tools and updates enhancing data analysis capabilities....

Top Statistical Software of 2024: A Comprehensive Comparison of Leading Tools for Data Analysis

In the ever-evolving world of data analysis, selecting the right statistical software is crucial for achieving accurate insights and informed decision-making. As we approach the latter half of 2024, the landscape of statistical software continues to advance, offering a variety of powerful tools for data professionals. This...

How the Law of Large Numbers is Shaping Data Science Innovations in 2024

In the ever-evolving field of data science, foundational principles play a crucial role in driving innovation and shaping new methodologies. Among these principles, the Law of Large Numbers (LLN) stands out as a pivotal concept that continues to influence the development of data science techniques and technologies....