In the field of statistics, the normal distribution is a fundamental concept that plays a crucial role in various statistical analyses and methodologies. Its widespread applicability and unique properties make it a cornerstone for statisticians and researchers across multiple disciplines. This article delves into the key concepts and applications of normal distribution, providing a comprehensive understanding essential for both beginners and seasoned statisticians.
What is a Normal Distribution?
The normal distribution, also known as the Gaussian distribution, is a continuous probability distribution characterized by its bell-shaped curve. It is defined by two parameters: the mean (μ) and the standard deviation (σ). The mean determines the center of the distribution, while the standard deviation measures the spread or dispersion of the data.
Key Properties of Normal Distribution
- Symmetry: The normal distribution is perfectly symmetrical around its mean. This means that the left and right sides of the curve are mirror images of each other.
- Bell-Shaped Curve: The curve of the normal distribution is bell-shaped, indicating that most of the data points cluster around the mean, with fewer points appearing as they move further away.
- Mean, Median, and Mode: In a normal distribution, the mean, median, and mode are all equal and located at the center of the distribution.
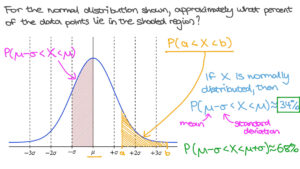
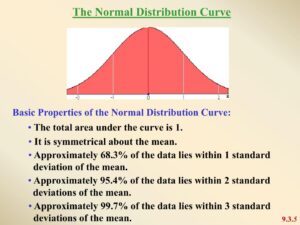
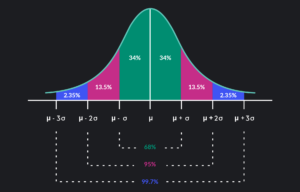
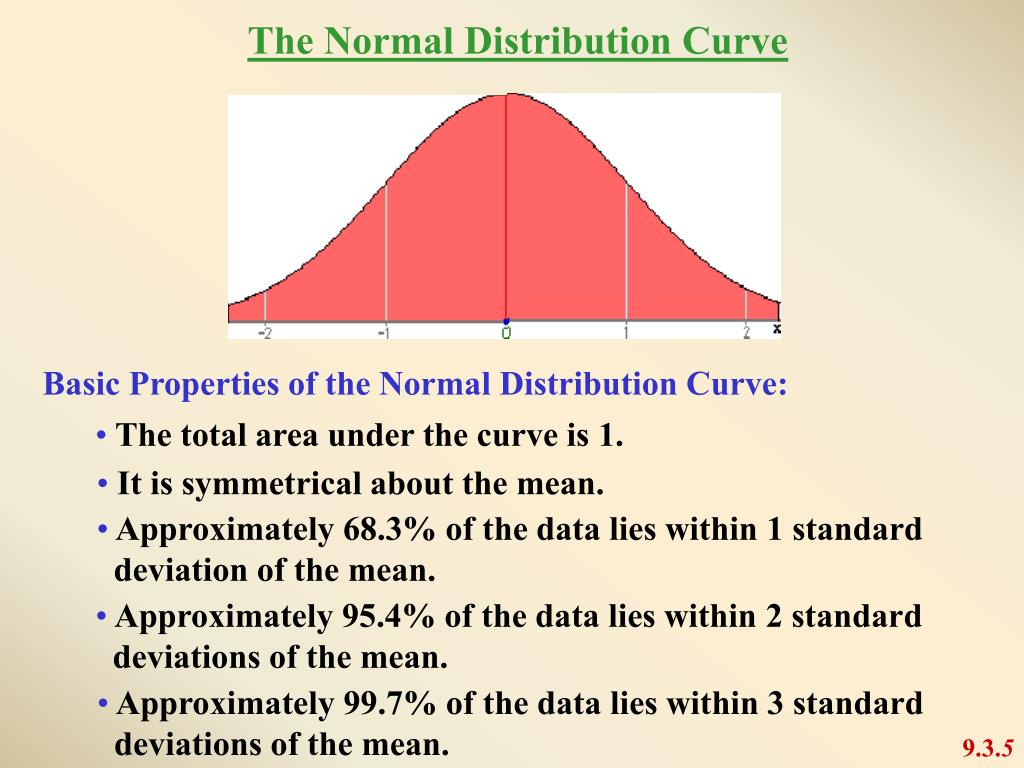
- Empirical Rule (68-95-99.7 Rule): Approximately 68% of the data lies within one standard deviation of the mean, 95% within two standard deviations, and 99.7% within three standard deviations.
Applications of Normal Distribution
1. Statistical Inference
One of the most significant applications of the normal distribution is in statistical inference. Many statistical tests, such as t-tests and z-tests, assume that the data follows a normal distribution. This assumption allows for the derivation of probability values and confidence intervals, facilitating hypothesis testing and decision-making processes.
2. Central Limit Theorem
The central limit theorem (CLT) states that the distribution of the sample means approximates a normal distribution, regardless of the shape of the population distribution, provided the sample size is sufficiently large. This principle is fundamental in inferential statistics, enabling the use of normal distribution for approximating the behavior of sample means.
3. Quality Control and Six Sigma
In quality control, the normal distribution is used to monitor and control manufacturing processes. Six Sigma methodologies, which aim to reduce defects and improve quality, rely heavily on the normal distribution to identify and eliminate variability in processes. By understanding the distribution of product measurements, companies can maintain high standards and minimize defects.
4. Finance and Economics
In finance and economics, the normal distribution is applied to model asset returns, stock prices, and risk assessment. Financial analysts use the properties of normal distribution to estimate the probability of different outcomes, aiding in portfolio management and investment strategies.
Practical Examples
1. Height Distribution
Human height is often modeled using a normal distribution. For instance, the height of adult males in a population can be represented with a mean and standard deviation, providing insights into the variability and probability of different height ranges within the group.
2. Standardized Testing
Scores on standardized tests, such as the SAT or IQ tests, are typically normally distributed. This allows for the comparison of individual scores against the population mean, facilitating the identification of outliers and the determination of percentiles.
Visualizing Normal Distribution
Visualization tools, such as histograms and probability density functions (PDFs), are essential for understanding and interpreting normal distributions. These tools help in identifying patterns, assessing the fit of the data to a normal distribution, and communicating statistical findings effectively.
Conclusion
The normal distribution is a powerful and versatile tool in statistics, underpinning many statistical methods and applications. Its properties of symmetry, central tendency, and the empirical rule make it indispensable for statistical analysis, quality control, finance, and numerous other fields. By mastering the concepts and applications of normal distribution, statisticians and researchers can make informed decisions, conduct rigorous analyses, and derive meaningful insights from their data.


