In the rapidly evolving landscape of data science and predictive analytics, multiple regression analysis stands out as a cornerstone technique for modeling and forecasting. As we advance into 2024, leveraging multiple regression analysis offers unprecedented opportunities for enhancing predictive modeling across various sectors. This article delves into how multiple regression analysis can be utilized to drive accuracy and insights in predictive modeling, ensuring relevance in today’s data-driven world.
What is Multiple Regression Analysis?
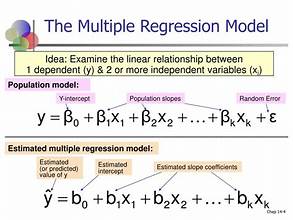
Multiple regression analysis is a statistical technique used to examine the relationship between one dependent variable and two or more independent variables. By modeling these relationships, it enables analysts to understand how different factors influence an outcome and make more informed predictions.
For instance, in a business context, multiple regression can help understand how various marketing strategies (independent variables) affect sales performance (dependent variable). This approach helps in identifying which strategies are most effective and in optimizing future campaigns.
The Evolution of Predictive Modeling
Predictive modeling has undergone significant transformations over the years. Traditionally, linear regression models were the go-to tools for forecasting. However, as data complexity increased, more sophisticated techniques emerged. In 2024, predictive modeling encompasses a range of advanced methodologies, including machine learning algorithms and artificial intelligence.
Despite these advancements, multiple regression analysis remains a fundamental tool. Its simplicity and interpretability make it valuable for preliminary analysis and for providing a clear understanding of the relationships between variables.
Benefits of Multiple Regression Analysis in 2024
- Enhanced Accuracy in Predictions
Multiple regression analysis improves prediction accuracy by accounting for multiple variables simultaneously. Unlike simple linear regression, which examines only one independent variable, multiple regression integrates various predictors, leading to more precise and reliable forecasts.
For example, a real estate company can use multiple regression to predict property prices by analyzing factors such as location, size, number of bedrooms, and local amenities. This comprehensive approach helps in generating more accurate price estimates compared to models that consider only one factor at a time.
- Identification of Key Influencers
One of the significant advantages of multiple regression is its ability to identify and quantify the influence of each predictor on the dependent variable. By examining the coefficients of the regression model, analysts can determine which factors have the most substantial impact.
In a healthcare setting, multiple regression can reveal how different patient characteristics, such as age, weight, and pre-existing conditions, contribute to health outcomes. This insight helps in tailoring personalized treatment plans and improving patient care.
- Control for Confounding Variables

Confounding variables are external factors that can distort the apparent relationship between the independent and dependent variables. Multiple regression analysis helps control for these confounders by including them in the model, thereby isolating the effect of the primary predictors.
For instance, in a study on the impact of education level on income, including variables like work experience and industry type helps in controlling for potential confounding effects, providing a clearer understanding of education’s direct influence on income.
- Versatility Across Industries
Multiple regression analysis is highly versatile and applicable across various industries. Whether in finance, marketing, healthcare, or manufacturing, this technique provides valuable insights that drive decision-making.
- Finance: In financial forecasting, multiple regression can predict stock prices based on economic indicators, market trends, and company performance metrics.
- Marketing: Marketers use multiple regression to evaluate the effectiveness of different advertising channels and optimize budget allocation.
- Healthcare: Predictive models help in forecasting disease outbreaks and patient outcomes based on various health and environmental factors.
Implementing Multiple Regression Analysis
To leverage multiple regression analysis effectively, follow these steps:
- Data Collection and Preparation
Begin by gathering relevant data for the independent and dependent variables. Ensure that the data is clean, complete, and properly formatted. Data preparation involves handling missing values, outliers, and ensuring that variables are measured accurately.
- Model Specification
Define the regression model by selecting the appropriate independent variables based on theoretical understanding and previous research. It’s essential to choose predictors that have a logical relationship with the dependent variable.
- Model Fitting and Evaluation
Use statistical software to fit the regression model to your data. Evaluate the model’s performance by examining metrics such as R-squared, adjusted R-squared, and p-values. Ensure that the model meets the assumptions of linearity, independence, homoscedasticity, and normality of residuals.
- Interpreting Results
Analyze the regression coefficients to interpret the relationship between each independent variable and the dependent variable. Assess the significance of predictors and their practical implications for your specific context.
- Refinement and Validation
Continuously refine the model by testing different combinations of predictors and validating the model using out-of-sample data. Cross-validation techniques help in assessing the model’s robustness and generalizability.
Challenges and Considerations
While multiple regression analysis offers numerous benefits, it also comes with challenges:
- Multicollinearity: High correlation between independent variables can lead to multicollinearity, affecting the stability and interpretability of the model. Techniques such as variance inflation factor (VIF) analysis can help diagnose and address multicollinearity.
- Overfitting: Including too many predictors may lead to overfitting, where the model performs well on training data but poorly on new data. Regularization methods and model selection criteria can mitigate this issue.
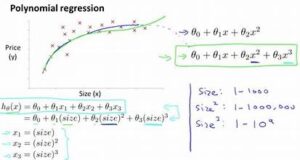
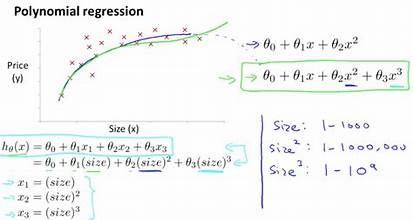
- Non-linearity: Multiple regression assumes a linear relationship between predictors and the dependent variable. When this assumption does not hold, alternative modeling approaches may be necessary.
Future Trends and Innovations
As data science continues to evolve, multiple regression analysis is likely to integrate with emerging technologies and methodologies. Innovations in computational power and algorithmic advancements will enhance the capabilities of regression models, making them even more powerful tools for predictive analytics.
- Integration with Machine Learning: Combining multiple regression with machine learning techniques can enhance model accuracy and flexibility. For instance, regression models can serve as feature selectors or be part of ensemble methods.
- Advanced Visualization Tools: New visualization tools will facilitate better understanding and communication of regression results, making it easier for stakeholders to interpret and act upon insights.
Conclusion
In 2024, leveraging multiple regression analysis for predictive modeling offers significant advantages for accurate forecasting, identifying key influencers, and controlling confounding variables. By following best practices and staying abreast of advancements in the field, businesses and researchers can harness the power of multiple regression to drive data-driven decisions and gain a competitive edge.
As the landscape of predictive analytics continues to evolve, embracing multiple regression analysis as part of a comprehensive approach will ensure that you remain at the forefront of data science and predictive modeling.


