In the realm of data analysis, mastering measures of central tendency is fundamental for extracting meaningful insights from complex datasets. As we advance into 2024, the importance of understanding these measures—mean, median, and mode—cannot be overstated. This article explores essential techniques and emerging trends to ensure accurate data analysis in the current landscape.
What Are Measures of Central Tendency?
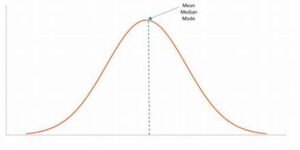
Measures of central tendency are statistical metrics used to determine the center of a dataset. They provide a summary statistic that represents the typical value within a data set, making them crucial for understanding and interpreting data effectively.
- Mean: The mean, or average, is calculated by summing all the values in a dataset and dividing by the number of values. It provides a measure of the central value but can be skewed by outliers.
Mean=∑i=1nxin\text{Mean} = \frac{\sum_{i=1}^{n} x_i}{n}Mean=n∑i=1nxi
- Median: The median is the middle value of a dataset when it is ordered from least to greatest. It is less affected by outliers and skewed data, making it a robust measure of central tendency.
Median={middle valueif n is oddvaluen/2+valuen/2+12if n is even\text{Median} = \begin{cases} \text{middle value} & \text{if } n \text{ is odd} \\ \frac{\text{value}_{n/2} + \text{value}_{n/2 + 1}}{2} & \text{if } n \text{ is even} \end{cases}Median={middle value2valuen/2+valuen/2+1if n is oddif n is even
- Mode: The mode is the value that appears most frequently in a dataset. A dataset may have one mode, more than one mode, or no mode at all.
Mode=most frequent value\text{Mode} = \text{most frequent value}Mode=most frequent value
Essential Techniques for Accurate Analysis
- Choosing the Right Measure
- Mean: Best used for data that follows a normal distribution without significant outliers. For example, it’s suitable for analyzing average test scores.
- Median: Ideal for skewed distributions or datasets with outliers. For instance, median income is often reported instead of mean income to avoid distortion from extremely high or low values.
- Mode: Useful for categorical data or understanding the most common occurrence. For example, determining the most popular product in a store.
- Handling Outliers

Outliers can significantly affect the mean, making the median a better choice in many cases. It is crucial to identify and address outliers to ensure that the central tendency measures accurately reflect the data.
- Visualization: Use box plots or scatter plots to detect outliers.
- Statistical Methods: Employ techniques like Z-scores or the IQR (Interquartile Range) to identify and handle outliers.
- Data Normalization
Normalizing data can help in comparing datasets on different scales. Techniques like z-score normalization or min-max scaling can be applied to make measures of central tendency more comparable across datasets.
- Utilizing Software Tools
Modern data analysis tools such as R, Python (with libraries like Pandas and NumPy), and specialized software (e.g., SPSS, SAS) offer advanced functionalities for calculating and interpreting measures of central tendency. These tools can automate the process, handle large datasets, and provide more accurate results.
- Contextual Interpretation
Understanding the context of the data is vital. For instance, in educational assessments, knowing whether the data is normally distributed or skewed helps in choosing between the mean and median.
Emerging Trends in 2024
- Incorporation of Artificial Intelligence
AI and machine learning algorithms are increasingly used to analyze and interpret large datasets. These technologies can automatically detect patterns, outliers, and trends, enhancing the accuracy of measures of central tendency.
- Predictive Analytics: AI tools can predict future trends based on historical data, providing deeper insights into central tendency measures.
- Automated Data Cleaning: AI can streamline the process of identifying and correcting data anomalies, improving the reliability of statistical measures.
- Big Data and Real-Time Analysis
With the rise of big data, the ability to analyze large volumes of data in real-time is becoming essential. Techniques for calculating central tendency measures are evolving to handle real-time data streams and large datasets effectively.
- Streaming Data: Tools and algorithms are being developed to compute measures of central tendency on-the-fly as data is collected, allowing for real-time insights.
- Distributed Computing: Technologies like Apache Hadoop and Spark are used to process and analyze massive datasets, including calculating central tendency metrics.
- Enhanced Visualization Techniques
Data visualization tools are evolving to provide more intuitive and interactive representations of central tendency measures. Modern dashboards and visualization platforms offer dynamic charts and graphs that can highlight trends and outliers effectively.
- Interactive Dashboards: Platforms like Tableau and Power BI provide interactive features that allow users to explore central tendency measures in-depth.
- Advanced Graphical Representations: Heatmaps, violin plots, and other advanced visualizations help in understanding the distribution of data and its central tendency.
- Integration with Business Intelligence
Measures of central tendency are increasingly integrated into business intelligence (BI) platforms to support data-driven decision-making. BI tools leverage these measures to provide actionable insights and strategic recommendations.
- Strategic Reporting: BI platforms use central tendency measures to generate reports that help businesses understand their performance and make informed decisions.
- Custom Analytics: Businesses can customize analytics to focus on specific central tendency measures relevant to their goals, such as customer satisfaction scores or sales averages.
Conclusion
Mastering measures of central tendency is crucial for accurate data analysis in 2024. By understanding and applying techniques such as choosing the right measure, handling outliers, and utilizing modern tools, analysts can extract meaningful insights from data. Emerging trends, including AI integration, big data analysis, and enhanced visualization, are shaping the future of data analysis, making it more efficient and insightful. Staying updated with these trends and techniques will ensure that your data analysis remains accurate and relevant in the evolving landscape.


