In an era dominated by information overload, effective data visualization has emerged as a crucial tool for communication and decision-making. As we move into 2024, the landscape of data visualization is evolving rapidly, fueled by advancements in technology, the rise of big data, and an increased emphasis on storytelling through data. This article explores the emerging techniques in data visualization that are set to shape the future, enhancing how we interpret and engage with data.
Understanding Data Visualization
Data visualization refers to the graphical representation of information and data. By using visual elements like charts, graphs, and maps, complex data sets are transformed into a more understandable format. The primary goal is to make it easier for people to see patterns, trends, and insights in the data. As organizations collect and analyze larger amounts of data, effective visualization becomes critical for ensuring that insights are communicated clearly and effectively.
The Importance of Data Visualization
In today’s data-driven world, the ability to interpret vast amounts of information is essential for businesses and individuals alike. Effective data visualization can lead to better decision-making, increased understanding, and more effective communication. Here are a few reasons why data visualization is crucial:
- Enhanced Understanding: Visuals can simplify complex data sets, allowing viewers to grasp intricate details at a glance.
- Faster Insights: Visual representations of data can lead to quicker recognition of trends and anomalies, aiding in rapid decision-making.
- Better Retention: Information presented visually is often more memorable than text-based data, enhancing learning and recall.
- Engagement: Well-designed visuals can captivate audiences, making data presentations more engaging and impactful.
Emerging Techniques in Data Visualization for 2024
As technology continues to evolve, so do the tools and techniques used in data visualization. Here are some of the most promising trends and techniques to watch in 2024:
1. AI-Powered Visualization Tools
Artificial Intelligence (AI) is revolutionizing data visualization by automating complex tasks and generating insights in real-time. AI-driven tools can analyze data sets and suggest the most effective ways to visualize the information. For instance, they can recommend the best chart type based on the data being presented, making it easier for users to create impactful visuals without extensive expertise in data analysis.
Key Benefits:
- Time-saving automation of visualization processes.
- Enhanced accuracy in identifying data patterns.
- Personalized visualization suggestions based on user preferences and data types.
2. Augmented Reality (AR) and Virtual Reality (VR)
AR and VR are taking data visualization to new heights by providing immersive experiences. These technologies allow users to interact with data in three-dimensional environments, making complex data sets more tangible. For example, businesses can use AR to overlay data visualizations onto physical spaces, enabling team members to explore data collaboratively.
Key Benefits:
- Enhanced engagement through interactive and immersive experiences.
- Improved spatial understanding of data relationships.
- Opportunities for collaboration and exploration in data analysis.
3. Storytelling with Data
As data becomes more prevalent, the need to convey messages effectively is paramount. Data storytelling combines data visualization with narrative techniques, allowing users to present data in a way that resonates emotionally with audiences. This technique is particularly useful in business settings, where stakeholders must understand the implications of data on strategy and outcomes.
Key Benefits:
- Improved communication of complex data insights.
- Greater audience engagement and emotional connection.
- Ability to highlight key messages and drive action through narratives.
4. Dynamic and Interactive Dashboards
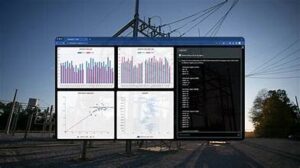
Dashboards are evolving to become more dynamic and interactive, allowing users to explore data in real-time. Modern dashboards enable users to drill down into data sets, filter information, and customize visualizations based on their preferences. This interactivity fosters a deeper understanding of data and encourages users to engage with information actively.
Key Benefits:
- Real-time insights and data exploration.
- Customizable views to suit individual needs and preferences.
- Enhanced decision-making through accessible data.
5. Data-Driven Infographics
Infographics have long been a staple in data visualization, but their evolution continues. In 2024, data-driven infographics that integrate real-time data feeds will gain popularity. These infographics will provide viewers with up-to-date information, making them more relevant and engaging. They can be used in various contexts, from marketing campaigns to educational materials.
Key Benefits:
- Timely and relevant information for audiences.
- Greater appeal through visual storytelling.
- Enhanced sharing potential on social media platforms.
6. Data Accessibility and Inclusivity
As data visualization techniques advance, there is a growing emphasis on accessibility and inclusivity. In 2024, expect to see more tools designed to ensure that data visualizations are accessible to all users, including those with disabilities. This includes features such as text descriptions for visuals, customizable color schemes, and compatibility with screen readers.
Key Benefits:
- Wider audience reach and engagement.
- Compliance with accessibility standards and regulations.
- Improved user experience for diverse audiences.
7. Geospatial Data Visualization
Geospatial data visualization, which involves the representation of data related to geographic locations, is becoming increasingly important as more organizations seek to understand data within the context of geography. This technique is particularly relevant for industries such as urban planning, logistics, and environmental science. In 2024, advancements in geospatial technologies will enhance the accuracy and detail of these visualizations.
Key Benefits:
- Better understanding of geographic trends and patterns.
- Improved decision-making based on location-specific data.
- Enhanced collaboration through shared geographic insights.
8. Real-Time Data Visualization
The demand for real-time data visualization is on the rise, driven by the need for timely insights in fast-paced environments. In 2024, tools that can visualize data as it is generated will become more prevalent. This capability is essential for industries such as finance, healthcare, and e-commerce, where decisions must be made quickly based on the latest information.
Key Benefits:
- Immediate access to crucial data insights.
- Enhanced responsiveness to changes in data.
- Improved operational efficiency through timely decision-making.
9. Integrating Data from Multiple Sources
In 2024, data visualization tools will increasingly focus on integrating data from various sources. By consolidating information from disparate systems, users can gain a more comprehensive view of their data landscape. This technique is vital for organizations that rely on data from multiple departments or external sources to inform their strategies.
Key Benefits:
- Holistic view of data for better analysis.
- Enhanced accuracy by reducing data silos.
- Improved collaboration between departments and teams.
Conclusion
The future of data visualization is bright and filled with possibilities. As we enter 2024, emerging techniques such as AI-powered tools, augmented and virtual reality, and interactive dashboards will redefine how we engage with data. By harnessing these innovations, organizations can enhance their decision-making processes, communicate insights more effectively, and ultimately drive better outcomes.


