Data analysis is a crucial aspect of various fields, including business, research, and technology. Central to data analysis are measures of central tendency, which summarize a set of data points into a single representative value. The three primary measures of central tendency are the mean, median, and mode. Understanding these concepts is essential for interpreting data accurately and making informed decisions.
Mean
The mean, often referred to as the average, is the sum of all data points divided by the number of data points. It provides a central value that represents the data set. The formula for calculating the mean is:
Mean(μ)=∑XN\text{Mean} (\mu) = \frac{\sum X}{N}Mean(μ)=N∑X
where ∑X\sum X∑X is the sum of all data points and NNN is the number of data points.
Advantages of the Mean
- Simplicity: Easy to calculate and understand.
- Uses all data points: Incorporates every data point in the data set, providing a comprehensive measure.
Disadvantages of the Mean
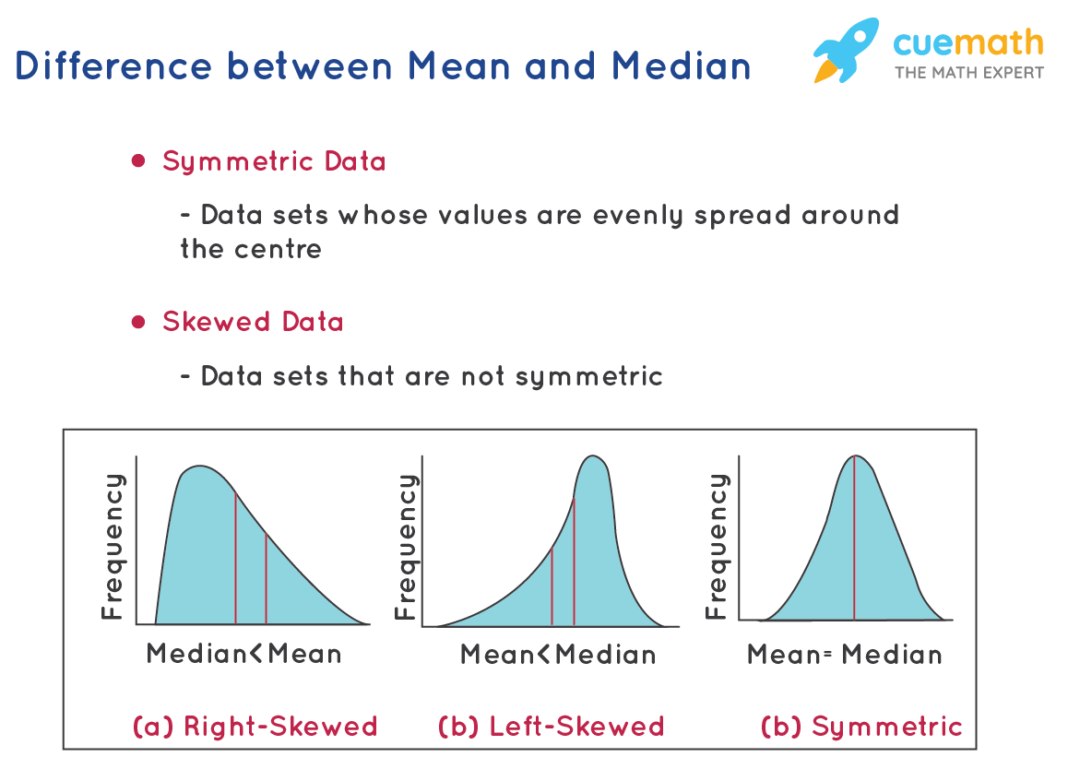
- Sensitivity to outliers: Outliers or extreme values can significantly skew the mean, making it unrepresentative of the data set.
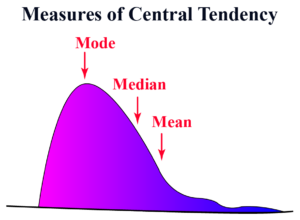
- Not suitable for skewed distributions: In highly skewed distributions, the mean may not accurately reflect the central tendency.
Median
The median is the middle value in a data set when the data points are arranged in ascending or descending order. If the number of data points is odd, the median is the middle value. If even, it is the average of the two middle values. The median is calculated as follows:
- Arrange the data points in ascending order.
- Identify the middle value(s):
- For odd NNN: Median=X(N+12)\text{Median} = X_{(\frac{N+1}{2})}Median=X(2N+1)
- For even NNN: Median=X(N2)+X(N2+1)2\text{Median} = \frac{X_{(\frac{N}{2})} + X_{(\frac{N}{2}+1)}}{2}Median=2X(2N)+X(2N+1)
Advantages of the Median
- Robustness: Not affected by outliers or extreme values, providing a better measure for skewed distributions.
- Intuitive: Represents the central point of the data.
Disadvantages of the Median
- Does not use all data points: Only considers the middle values, ignoring the rest of the data set.
- Less sensitive to changes in data: Small changes in data points may not affect the median.
Mode
The mode is the value that appears most frequently in a data set. A data set may have one mode (unimodal), more than one mode (bimodal or multimodal), or no mode if all values are unique. The mode is determined by identifying the most frequent data point(s).
Advantages of the Mode
- Applicability to categorical data: Useful for identifying the most common category in qualitative data.
- Simplicity: Easy to identify in a small data set.
Disadvantages of the Mode
- May not be unique: A data set can have multiple modes or no mode at all, complicating the analysis.
- Less informative: Does not consider the overall distribution of data.
Comparison and Use Cases
Choosing the Appropriate Measure
- Mean: Best used for data sets without outliers and with a normal distribution.
- Median: Preferred for skewed distributions or data sets with outliers.
- Mode: Ideal for categorical data or identifying the most frequent occurrence in a data set.
Practical Examples
- Mean: In business, the mean is often used to calculate average sales, expenses, or performance metrics.
- Median: In real estate, the median home price is a common measure, as it is less affected by extremely high or low prices.
- Mode: In market research, the mode can indicate the most popular product or service among consumers.
Conclusion
Understanding the mean, median, and mode is fundamental for data analysis. Each measure of central tendency provides unique insights into the data, and choosing the appropriate measure depends on the nature of the data set and the specific analysis requirements. By effectively utilizing these measures, analysts can summarize data accurately, identify trends, and make informed decisions.


