When analyzing data, understanding the central tendency is crucial for drawing meaningful conclusions. Central tendency measures—mean, median, and mode—summarize a set of data by identifying the central point within that dataset. However, choosing the right measure can be challenging. This article will help you understand when to use the mean, median, or mode to best represent your data.
What is Central Tendency?
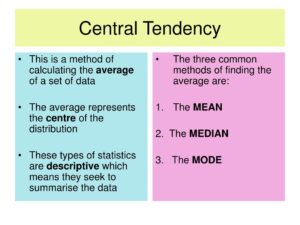
Central tendency refers to the middle or center of a data distribution. It provides an overall summary and can help in making comparisons between different datasets. The three main measures of central tendency are:
- Mean: The arithmetic average of a dataset.
- Median: The middle value that separates the higher half from the lower half.
- Mode: The most frequently occurring value in a dataset.
Each measure has its strengths and weaknesses, making it important to choose the one that best fits your data characteristics.
Mean: Pros and Cons
What is the Mean?
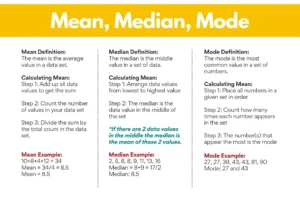
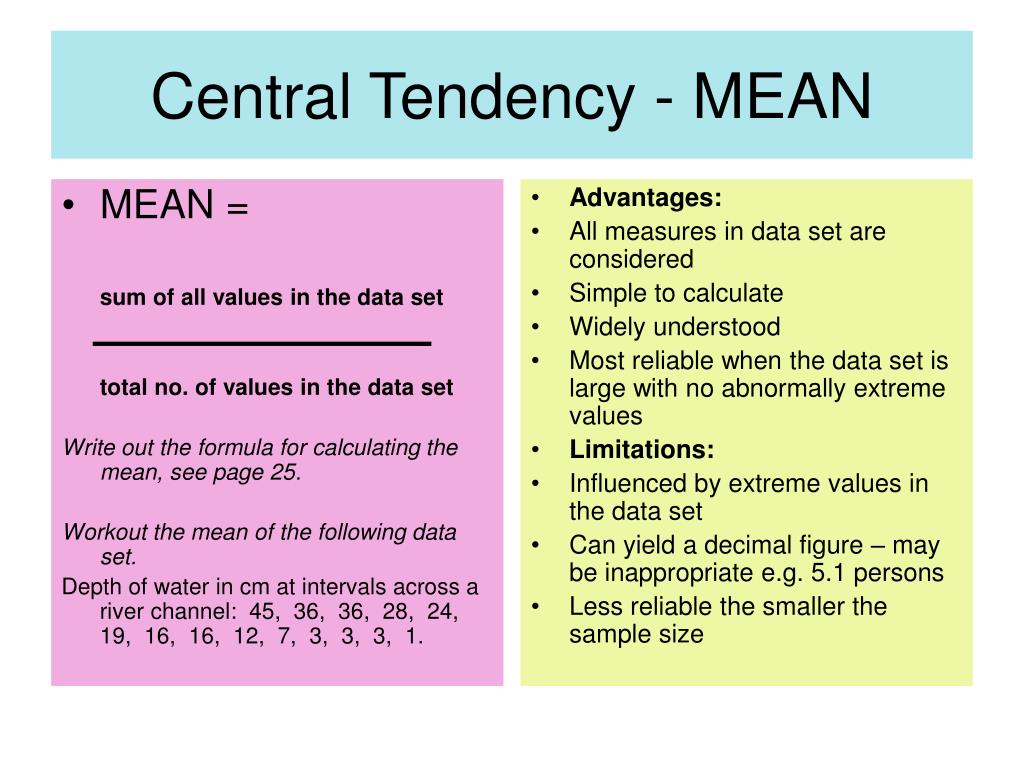
The mean is calculated by summing all the values in a dataset and dividing by the number of values. It is widely used in many fields because it takes into account all data points.
Pros of Using the Mean
- Simplicity: Easy to calculate and understand.
- Comprehensive: Incorporates all data points, providing a detailed summary.
- Mathematically Useful: Suitable for further statistical analysis and calculations.
Cons of Using the Mean
- Sensitive to Outliers: Extreme values can distort the mean, making it unrepresentative of the dataset.
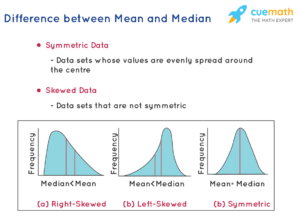
- Not Suitable for Skewed Distributions: In datasets with skewness, the mean may not accurately reflect the central tendency.
When to Use the Mean
The mean is best used when:
- The data is symmetrically distributed without outliers.
- You need a measure that includes all data points.
- Further statistical analysis is required.
Median: Pros and Cons
What is the Median?
The median is the middle value of a dataset when it is ordered from least to greatest. If the dataset has an even number of observations, the median is the average of the two middle numbers.
Pros of Using the Median
- Robust to Outliers: Not affected by extreme values.
- Reflects Skewed Distributions: Provides a better central tendency for skewed datasets.
- Simple to Determine: Especially for small datasets.
Cons of Using the Median
- Ignores Extremes: Does not take into account all values, which might lead to loss of information.
- Less Useful for Further Analysis: Not as mathematically tractable as the mean.
When to Use the Median
The median is ideal when:
- The dataset has outliers or is skewed.
- You need a measure that is not influenced by extreme values.
- The data is ordinal, meaning it has a meaningful order but not a uniform scale.
Mode: Pros and Cons
What is the Mode?
The mode is the value that appears most frequently in a dataset. A dataset can have more than one mode if multiple values have the same frequency.
Pros of Using the Mode
- Identifies Common Values: Shows the most frequent values in a dataset.
- Applicable to Categorical Data: Useful for qualitative data where mean and median cannot be applied.
- Unaffected by Outliers: Extreme values do not influence the mode.
Cons of Using the Mode
- Not Always Unique: Multiple modes can complicate the interpretation.
- May Not Reflect Central Tendency: In some datasets, the mode may not represent the data’s central point.
When to Use the Mode
The mode is best utilized when:
- The data is categorical or nominal.
- You are interested in the most common value.
- There are multiple peaks in the data distribution.
Choosing the Best Measure for Your Data
Step-by-Step Guide
- Understand Your Data: Determine the type of data (nominal, ordinal, interval, ratio) and look for outliers and skewness.
- Analyze Distribution: Plot the data to visualize its distribution. Check for symmetry and outliers.
- Compare Measures: Calculate the mean, median, and mode. Compare how they represent your data.
- Consider Purpose: Think about your analysis goals. Do you need a robust measure against outliers (median), or a mathematically useful measure (mean), or the most frequent observation (mode)?
Practical Examples
- House Prices: When analyzing house prices, the median is often preferred due to the presence of extreme values (e.g., very high or very low prices).
- Test Scores: In education, the mean is commonly used to calculate average scores unless the data is highly skewed or contains outliers.
- Customer Preferences: For categorical data like customer preferences or survey responses, the mode is most appropriate.
Conclusion
Choosing the best measure of central tendency depends on the nature of your data and the specific context of your analysis. The mean is useful for symmetrical data without outliers, the median is robust for skewed data, and the mode is ideal for categorical data. By understanding the strengths and weaknesses of each measure, you can select the most appropriate one to accurately represent your dataset.


