HomeInferential StatisticsUnderstanding Statistical Significance: How...

Understanding Statistical Significance: How It Impacts Research Outcomes and Decision-Making

In the realm of research and data analysis, statistical significance is a cornerstone concept that influences the interpretation of results and subsequent decision-making. This article will explore what statistical significance is, why it matters, and how it impacts research outcomes and decision-making processes.

What is Statistical Significance?

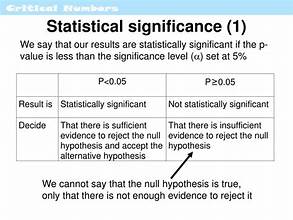
Statistical significance is a measure used to determine whether the results of a study are likely to be due to chance or if they reflect a true effect. It is typically assessed through hypothesis testing, where researchers test an initial assumption (null hypothesis) against an alternative hypothesis. The result is quantified using a p-value, which indicates the probability of obtaining the observed results if the null hypothesis were true.

Key Definitions:

  • Null Hypothesis (H0): The default position that there is no effect or no difference.
  • Alternative Hypothesis (H1): The position that there is an effect or a difference.
  • P-value: The probability of observing the test results under the null hypothesis. A p-value less than the chosen significance level (often 0.05) indicates statistical significance.

Why Statistical Significance Matters

Statistical significance provides a framework for evaluating the validity of research findings. Here are a few reasons why it is crucial:

  1. Validity of Results: Statistical significance helps determine whether the observed effects in a study are genuine or if they occurred by random chance. This helps in validating the research findings.
  2. Decision-Making: In fields such as medicine, social sciences, and economics, statistically significant results can influence policy decisions, medical treatments, and business strategies. Accurate significance testing ensures that these decisions are based on reliable evidence.
  3. Resource Allocation: Organizations often use statistical significance to justify the allocation of resources. For instance, a significant finding might lead to further investment in a particular area of research.

How Statistical Significance Impacts Research Outcomes

  1. Interpreting Results:
    • Significant Results: A statistically significant result suggests that the observed effect is unlikely to have occurred by chance. For example, if a new drug shows significant improvement in patient outcomes compared to a placebo, it may be considered effective.
    • Non-Significant Results: If a result is not statistically significant, it means there is insufficient evidence to reject the null hypothesis. This does not prove that there is no effect, but rather that the evidence is not strong enough to support it.
  2. Influence on Research Direction:
    • Publication Bias: Significant results are more likely to be published, which can lead to publication bias. Researchers and journals may favor studies with significant findings, potentially skewing the overall scientific literature.
    • Future Research: Significant results can pave the way for further research, while non-significant findings might prompt researchers to reconsider their hypotheses or methods.

Factors Affecting Statistical Significance

  1. Sample Size: Larger sample sizes generally provide more accurate estimates of the population parameters and increase the likelihood of detecting a true effect. Small sample sizes can lead to less reliable results and higher variability.
  2. Effect Size: The magnitude of the effect observed in a study also plays a role. Even a small effect can be statistically significant if the sample size is large enough, while a large effect might not be significant if the sample size is too small.
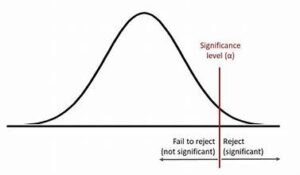
  3. Significance Level (α): The threshold for statistical significance (commonly set at 0.05) is the probability of rejecting the null hypothesis when it is actually true (Type I error). Researchers must choose an appropriate significance level based on the context of their study.

Common Misconceptions About Statistical Significance

  1. Statistical Significance vs. Practical Significance: A result can be statistically significant but not practically meaningful. For example, a study may find a statistically significant difference in test scores between two teaching methods, but if the difference is minimal, it may not have practical implications.
  2. P-value Misinterpretation: A p-value is not the probability that the null hypothesis is true, nor does it measure the size of the effect. It only indicates the likelihood of observing the results given that the null hypothesis is true.

Statistical Significance and Decision-Making
  1. Policy and Practice: In policy-making, statistically significant findings can drive changes in laws or regulations. For instance, a study showing a significant correlation between air pollution and health issues might lead to stricter environmental regulations.
  2. Business Strategies: Companies use statistical significance to evaluate marketing campaigns, product performance, and customer satisfaction. Significant results can lead to strategic decisions that enhance business outcomes.
  3. Medical Interventions: In medicine, clinical trials rely on statistical significance to determine the efficacy of treatments. A statistically significant result can lead to the approval of new drugs or medical procedures.

Conclusion

Understanding statistical significance is essential for interpreting research findings and making informed decisions. By providing a measure of whether observed effects are likely due to chance, statistical significance helps ensure that decisions are based on reliable evidence. However, it is crucial to consider other factors, such as effect size and practical implications, to fully understand the impact of research outcomes.

- A word from our sponsors -

spot_img

Most Popular

LEAVE A REPLY

Please enter your comment!
Please enter your name here

More from Author

The Future of Data Visualization: Emerging Techniques to Watch in 2024

In an era dominated by information overload, effective data visualization has...

Why Confidence Intervals Are Crucial for Medical Research: Insights for 2024

Confidence intervals (CIs) are a vital component of statistical analysis, especially...

Mastering Measures of Dispersion: A Comprehensive Guide for Data Scientists in 2024

  In the world of data science, understanding how data varies is...

Mastering R Programming for Advanced Statistical Analysis: Top Techniques and Tools for 2024

In the ever-evolving world of data science, R programming stands out...

- A word from our sponsors -

spot_img

Read Now

The Future of Data Visualization: Emerging Techniques to Watch in 2024

In an era dominated by information overload, effective data visualization has emerged as a crucial tool for communication and decision-making. As we move into 2024, the landscape of data visualization is evolving rapidly, fueled by advancements in technology, the rise of big data, and an increased emphasis...

Why Confidence Intervals Are Crucial for Medical Research: Insights for 2024

Confidence intervals (CIs) are a vital component of statistical analysis, especially in medical research. They provide a range of values that help researchers determine the reliability and precision of study results. In 2024, as medical research continues to evolve with advancements in technology and data collection, the...

Mastering Measures of Dispersion: A Comprehensive Guide for Data Scientists in 2024

  In the world of data science, understanding how data varies is crucial for making informed decisions and drawing accurate conclusions. Measures of dispersion, also known as measures of variability, provide insights into the spread and variability of data points within a dataset. This comprehensive guide will explore...

Mastering R Programming for Advanced Statistical Analysis: Top Techniques and Tools for 2024

In the ever-evolving world of data science, R programming stands out as a robust tool for advanced statistical analysis. With its rich ecosystem of packages and powerful capabilities, R continues to be a top choice for statisticians, data analysts, and researchers. As we move into 2024, mastering...

Understanding Probability Distributions: Key Concepts and Their Applications in Data Science

In the realm of data science, understanding probability distributions is fundamental to analyzing and interpreting data. These distributions provide insights into the variability and likelihood of different outcomes, enabling data scientists to make informed decisions and predictions. This article delves into key concepts of probability distributions and...

Mastering Linear Regression Models in 2024: Advanced Techniques and Best Practices for Accurate Predictions

In 2024, linear regression continues to be a cornerstone technique in data science and predictive analytics. Its simplicity, interpretability, and effectiveness make it an essential tool for professionals seeking to model relationships between variables and make informed predictions. This article explores advanced techniques and best practices for...

Mastering Hypothesis Testing: The Latest Techniques and Trends for Data Analysis in 2024

In the ever-evolving world of data analysis, hypothesis testing remains a cornerstone for drawing meaningful conclusions from empirical data. As we navigate through 2024, advancements in technology and methodology continue to reshape how we approach and execute hypothesis testing. This comprehensive guide explores the latest techniques and...

Top 5 Practical Uses of Measures of Central Tendency in Modern Statistical Analysis

  In modern statistical analysis, measures of central tendency are foundational tools used to summarize and interpret data sets. These measures—mean, median, and mode—provide insights into the central point around which data values cluster. Understanding their practical applications is crucial for data-driven decision-making across various fields. This article...

Mastering Measures of Central Tendency: Essential Techniques and Trends for Accurate Data Analysis in 2024

In the realm of data analysis, mastering measures of central tendency is fundamental for extracting meaningful insights from complex datasets. As we advance into 2024, the importance of understanding these measures—mean, median, and mode—cannot be overstated. This article explores essential techniques and emerging trends to ensure accurate...

Top Statistical Software for 2024: A Comprehensive Comparison of Leading Tools

In the rapidly evolving world of data analysis, selecting the right statistical software is crucial for obtaining accurate results and making informed decisions. As we move into 2024, the landscape of statistical software is more dynamic than ever, with new tools and updates enhancing data analysis capabilities....

Top Statistical Software of 2024: A Comprehensive Comparison of Leading Tools for Data Analysis

In the ever-evolving world of data analysis, selecting the right statistical software is crucial for achieving accurate insights and informed decision-making. As we approach the latter half of 2024, the landscape of statistical software continues to advance, offering a variety of powerful tools for data professionals. This...

How the Law of Large Numbers is Shaping Data Science Innovations in 2024

In the ever-evolving field of data science, foundational principles play a crucial role in driving innovation and shaping new methodologies. Among these principles, the Law of Large Numbers (LLN) stands out as a pivotal concept that continues to influence the development of data science techniques and technologies....