In the realm of data science and statistical modeling, predictive accuracy is crucial for making informed decisions based on data. One important technique used to improve the accuracy of predictive models is residual analysis. This article delves into the role of residual analysis in enhancing predictive model accuracy, exploring its importance, methodologies, and practical applications.
Understanding Residuals
Residuals are the differences between observed values and the values predicted by a model. In mathematical terms, if yiy_iyi represents the observed value and y^i\hat{y}_iy^i denotes the predicted value for a particular observation iii, then the residual eie_iei is given by:
ei=yi−y^ie_i = y_i – \hat{y}_iei=yi−y^i
Residuals play a vital role in assessing the performance of predictive models. By examining residuals, data scientists can gain insights into how well a model fits the data and identify potential areas for improvement.
The Importance of Residual Analysis
Residual analysis is essential for several reasons:
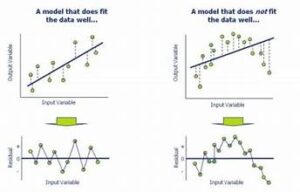
- Model Fit Assessment: Analyzing residuals helps determine how well the model fits the data. Ideally, residuals should be randomly scattered around zero with no discernible patterns. This indicates that the model has captured the underlying data structure well.
- Identifying Model Misspecification: Residual plots can reveal if the model is misspecified. For example, systematic patterns in residuals may suggest that the model is not appropriately capturing certain relationships in the data.
- Detecting Outliers: Residual analysis helps in identifying outliers or anomalies. Large residuals might indicate unusual or influential data points that can significantly impact model accuracy.
- Assessing Homoscedasticity: Residual plots can be used to check for homoscedasticity, which means that the variance of residuals should be constant across all levels of the independent variables. If residuals exhibit a pattern of increasing or decreasing variance, it indicates heteroscedasticity, which can affect model performance.
Methods for Residual Analysis
Several methods are employed for residual analysis, each providing unique insights into model performance:
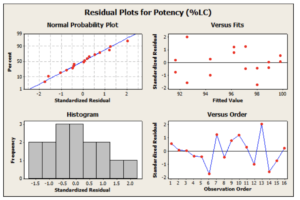
- Residual Plots: These plots display residuals on the y-axis and fitted values or another variable on the x-axis. They help visualize the relationship between residuals and predicted values. A random scatter of residuals around zero suggests a good model fit.
- Q-Q Plots: Quantile-Quantile (Q-Q) plots compare the distribution of residuals to a theoretical normal distribution. Deviations from the diagonal line in a Q-Q plot indicate departures from normality, which might suggest the need for model adjustments.
- Leverage and Influence Measures: Metrics such as Cook’s distance and leverage help identify influential data points that disproportionately affect the model. High leverage points or influential observations can be investigated further to understand their impact on the model.
- Histogram of Residuals: A histogram provides a visual representation of the distribution of residuals. Ideally, residuals should be normally distributed, which supports the assumption of normally distributed errors in many statistical models.
- Durbin-Watson Test: This statistical test assesses autocorrelation in residuals, particularly for time series data. It helps determine whether residuals are independent of one another, which is important for accurate modeling.
Practical Applications of Residual Analysis
- Model Improvement: By analyzing residuals, data scientists can make iterative improvements to models. For instance, if residuals show a pattern, it may indicate the need to include additional predictors or transform existing variables.
- Algorithm Selection: Residual analysis can guide the selection of the appropriate modeling algorithm. For example, if residuals exhibit non-linearity, a non-linear model or polynomial regression might be more suitable.
- Validation of Assumptions: Many statistical models rely on specific assumptions, such as normality and homoscedasticity of residuals. Residual analysis helps validate these assumptions, ensuring that the model’s theoretical foundations are sound.
- Communication of Model Performance: Residual analysis provides a clear and interpretable way to communicate model performance to stakeholders. Visualizations and metrics derived from residual analysis can help non-technical audiences understand the strengths and limitations of the model.
Best Practices for Residual Analysis
- Consistent Methodology: Apply residual analysis methods consistently across different models to ensure comparability. This helps in making objective assessments of model performance.
- Holistic Approach: Combine residual analysis with other evaluation metrics, such as mean squared error (MSE) and R-squared, for a comprehensive assessment of model accuracy.
- Iterative Process: Residual analysis should be part of an iterative modeling process. Continuously analyze and refine models based on residual insights to enhance predictive accuracy.
- Documentation: Document findings from residual analysis, including any identified patterns or issues. This documentation helps in understanding model behavior and guiding future improvements.
Conclusion
Residual analysis is a powerful tool for enhancing the accuracy of predictive models. By examining residuals, data scientists can assess model fit, identify potential issues, and make informed adjustments to improve performance. Employing various residual analysis methods and adhering to best practices ensures that models are robust, reliable, and accurate. As data continues to play a crucial role in decision-making, mastering residual analysis becomes an essential skill for data scientists and analysts striving for excellence in predictive modeling.


