HomeDescriptive StatisticsTop 5 Practical Uses...

Top 5 Practical Uses of Measures of Central Tendency in Modern Statistical Analysis


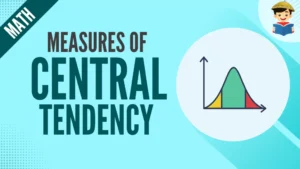
In modern statistical analysis, measures of central tendency are foundational tools used to summarize and interpret data sets. These measures—mean, median, and mode—provide insights into the central point around which data values cluster. Understanding their practical applications is crucial for data-driven decision-making across various fields. This article explores the top five practical uses of measures of central tendency in contemporary statistical analysis, highlighting their significance and real-world applications.

1. Benchmarking Performance

In business and finance, benchmarking performance is vital for setting standards and measuring progress. Measures of central tendency play a critical role in this process. For example:

  • Mean: Businesses often use the mean to assess average performance metrics, such as average sales per quarter or average customer satisfaction scores. By comparing these means against industry benchmarks, companies can gauge their performance relative to competitors.
  • Median: When evaluating salaries or compensation packages, the median is often preferred over the mean to avoid skewed results due to extreme values. For instance, in a company with a few top executives earning significantly higher salaries than the rest, the median salary provides a more accurate reflection of the typical employee’s earnings.
  • Mode: In product development, identifying the most frequently purchased product or the most common customer feedback can help businesses focus on popular features or common issues.

2. Quality Control in Manufacturing

In manufacturing, maintaining quality control is essential for producing consistent and reliable products. Measures of central tendency are employed to monitor and improve quality:

  • Mean: Manufacturers use the mean to track average measurements of product dimensions or weights. For example, if a factory produces widgets, the mean weight of these widgets can be compared to the target weight to ensure they meet quality standards.
  • Median: When dealing with large batches of products, the median is used to minimize the impact of outliers. For instance, in a batch of electronic components, the median resistance value ensures that the majority of components are within acceptable tolerance levels, even if a few components deviate significantly.
  • Mode: Quality control teams may use the mode to identify the most frequent defect type or error code in production. This helps prioritize corrective actions and improve overall product quality.

3. Educational Assessment and Evaluation

Educational institutions use measures of central tendency to assess and evaluate student performance:

  • Mean: The average score of students on standardized tests or exams is computed using the mean. This helps educators understand overall student performance and identify areas where students may need additional support.
  • Median: In cases where test scores are heavily skewed by a few very high or very low scores, the median provides a more accurate measure of typical student performance. For instance, if a class has a few students with exceptionally high scores, the median score reflects the performance of the majority of students more effectively than the mean.
  • Mode: The mode is used to identify the most common grade or score. This can be useful for understanding common performance levels and tailoring educational interventions to address prevalent issues.

4. Healthcare and Medical Research
In healthcare and medical research, measures of central tendency help in analyzing patient data and treatment outcomes:

  • Mean: Researchers use the mean to analyze average patient outcomes, such as average blood pressure levels before and after treatment. This provides insights into the effectiveness of medical interventions.
  • Median: In clinical trials, the median survival time of patients can provide a more accurate picture of typical outcomes, especially in cases where survival times are highly variable. The median survival time is less influenced by outliers and offers a clearer understanding of the central tendency of patient outcomes.
  • Mode: The mode can be used to identify the most common symptoms or diagnoses among patients. This information can be crucial for developing treatment protocols and understanding the prevalence of certain conditions.

5. Marketing and Consumer Research

In marketing and consumer research, measures of central tendency help businesses understand consumer preferences and behavior:

  • Mean: Marketers use the mean to analyze average spending habits, such as average purchase amount or average customer lifetime value. This helps in budgeting and targeting marketing strategies effectively.
  • Median: When analyzing income data or purchase amounts, the median provides a better representation of typical consumer behavior, especially when data is skewed by a small number of very high or very low values.
  • Mode: Identifying the mode of consumer preferences or most common product features can guide product development and marketing strategies. For example, if a certain product feature is the most frequently requested, businesses can prioritize its inclusion in new product designs.

Conclusion
Measures of central tendency—mean, median, and mode—are indispensable tools in modern statistical analysis, providing valuable insights across various domains. Whether it’s for benchmarking performance, maintaining quality control, assessing educational outcomes, analyzing medical data, or understanding consumer behavior, these measures help summarize complex data sets and guide informed decision-making. By leveraging these statistical tools effectively, organizations and researchers can gain a clearer understanding of their data and make strategic decisions that drive success.

- A word from our sponsors -

spot_img

Most Popular

LEAVE A REPLY

Please enter your comment!
Please enter your name here

More from Author

The Future of Data Visualization: Emerging Techniques to Watch in 2024

In an era dominated by information overload, effective data visualization has...

Why Confidence Intervals Are Crucial for Medical Research: Insights for 2024

Confidence intervals (CIs) are a vital component of statistical analysis, especially...

Mastering Measures of Dispersion: A Comprehensive Guide for Data Scientists in 2024

  In the world of data science, understanding how data varies is...

Mastering R Programming for Advanced Statistical Analysis: Top Techniques and Tools for 2024

In the ever-evolving world of data science, R programming stands out...

- A word from our sponsors -

spot_img

Read Now

The Future of Data Visualization: Emerging Techniques to Watch in 2024

In an era dominated by information overload, effective data visualization has emerged as a crucial tool for communication and decision-making. As we move into 2024, the landscape of data visualization is evolving rapidly, fueled by advancements in technology, the rise of big data, and an increased emphasis...

Why Confidence Intervals Are Crucial for Medical Research: Insights for 2024

Confidence intervals (CIs) are a vital component of statistical analysis, especially in medical research. They provide a range of values that help researchers determine the reliability and precision of study results. In 2024, as medical research continues to evolve with advancements in technology and data collection, the...

Mastering Measures of Dispersion: A Comprehensive Guide for Data Scientists in 2024

  In the world of data science, understanding how data varies is crucial for making informed decisions and drawing accurate conclusions. Measures of dispersion, also known as measures of variability, provide insights into the spread and variability of data points within a dataset. This comprehensive guide will explore...

Mastering R Programming for Advanced Statistical Analysis: Top Techniques and Tools for 2024

In the ever-evolving world of data science, R programming stands out as a robust tool for advanced statistical analysis. With its rich ecosystem of packages and powerful capabilities, R continues to be a top choice for statisticians, data analysts, and researchers. As we move into 2024, mastering...

Understanding Probability Distributions: Key Concepts and Their Applications in Data Science

In the realm of data science, understanding probability distributions is fundamental to analyzing and interpreting data. These distributions provide insights into the variability and likelihood of different outcomes, enabling data scientists to make informed decisions and predictions. This article delves into key concepts of probability distributions and...

Mastering Linear Regression Models in 2024: Advanced Techniques and Best Practices for Accurate Predictions

In 2024, linear regression continues to be a cornerstone technique in data science and predictive analytics. Its simplicity, interpretability, and effectiveness make it an essential tool for professionals seeking to model relationships between variables and make informed predictions. This article explores advanced techniques and best practices for...

Mastering Hypothesis Testing: The Latest Techniques and Trends for Data Analysis in 2024

In the ever-evolving world of data analysis, hypothesis testing remains a cornerstone for drawing meaningful conclusions from empirical data. As we navigate through 2024, advancements in technology and methodology continue to reshape how we approach and execute hypothesis testing. This comprehensive guide explores the latest techniques and...

Mastering Measures of Central Tendency: Essential Techniques and Trends for Accurate Data Analysis in 2024

In the realm of data analysis, mastering measures of central tendency is fundamental for extracting meaningful insights from complex datasets. As we advance into 2024, the importance of understanding these measures—mean, median, and mode—cannot be overstated. This article explores essential techniques and emerging trends to ensure accurate...

Top Statistical Software for 2024: A Comprehensive Comparison of Leading Tools

In the rapidly evolving world of data analysis, selecting the right statistical software is crucial for obtaining accurate results and making informed decisions. As we move into 2024, the landscape of statistical software is more dynamic than ever, with new tools and updates enhancing data analysis capabilities....

Top Statistical Software of 2024: A Comprehensive Comparison of Leading Tools for Data Analysis

In the ever-evolving world of data analysis, selecting the right statistical software is crucial for achieving accurate insights and informed decision-making. As we approach the latter half of 2024, the landscape of statistical software continues to advance, offering a variety of powerful tools for data professionals. This...

How the Law of Large Numbers is Shaping Data Science Innovations in 2024

In the ever-evolving field of data science, foundational principles play a crucial role in driving innovation and shaping new methodologies. Among these principles, the Law of Large Numbers (LLN) stands out as a pivotal concept that continues to influence the development of data science techniques and technologies....

Understanding the Law of Large Numbers: Key Insights and Applications in Data Science for 2024

In the realm of data science, understanding statistical principles is crucial for deriving meaningful insights and making informed decisions. One such principle is the Law of Large Numbers (LLN), a foundational concept that underpins much of statistical analysis and data science methodologies. As we navigate through 2024,...