In the realm of data science, understanding probability distributions is fundamental to analyzing and interpreting data. These distributions provide insights into the variability and likelihood of different outcomes, enabling data scientists to make informed decisions and predictions. This article delves into key concepts of probability distributions and their applications in data science, offering a comprehensive guide to these essential tools.
What is a Probability Distribution?
A probability distribution is a statistical function that describes the likelihood of different outcomes in an experiment or process. It assigns probabilities to each possible outcome, allowing us to model and predict various scenarios. Probability distributions can be classified into two main types: discrete and continuous.
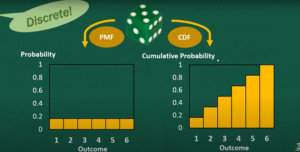
- Discrete Probability Distributions: These deal with scenarios where outcomes are distinct and countable. Examples include the roll of a die or the number of customer purchases in a day.
- Continuous Probability Distributions: These cover situations where outcomes are not countable but fall within a range. Examples include heights of people or temperatures over a month.
Key Concepts in Probability Distributions
- Probability Density Function (PDF): For continuous distributions, the PDF provides the probability of a variable falling within a particular range. It is a function whose integral over a given interval equals the probability of the variable falling within that interval.
- Probability Mass Function (PMF): For discrete distributions, the PMF gives the probability that a discrete random variable is exactly equal to some value. Each outcome has a specific probability, and the sum of all probabilities in the PMF equals 1.
- Cumulative Distribution Function (CDF): The CDF represents the probability that a random variable will take a value less than or equal to a given point. It is useful for understanding the distribution of values up to a certain threshold.
- Expected Value (Mean): The expected value is the long-term average value of a random variable. It is calculated by summing the products of each possible value and its probability. For a discrete variable, it is E(X)=∑(xi⋅P(xi))E(X) = \sum (x_i \cdot P(x_i))E(X)=∑(xi⋅P(xi)), and for a continuous variable, it is E(X)=∫x⋅f(x) dxE(X) = \int x \cdot f(x) \, dxE(X)=∫x⋅f(x)dx.
- Variance and Standard Deviation: Variance measures the spread of the distribution around the mean. It is calculated as the average of the squared differences from the mean. The standard deviation is the square root of the variance, providing a measure of dispersion in the same units as the data.
Common Probability Distributions
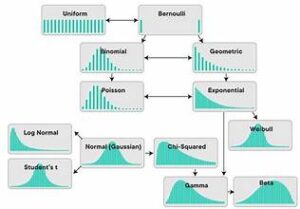
- Normal Distribution: Also known as the Gaussian distribution, the normal distribution is characterized by its bell-shaped curve. It is defined by its mean and standard deviation and is widely used due to the Central Limit Theorem, which states that the distribution of sample means approaches a normal distribution as the sample size increases.
- Binomial Distribution: This distribution models the number of successes in a fixed number of independent Bernoulli trials (binary outcomes). It is defined by two parameters: the number of trials and the probability of success in each trial.
- Poisson Distribution: The Poisson distribution describes the probability of a given number of events occurring in a fixed interval of time or space, given a constant mean rate of occurrence. It is useful for modeling rare events.
- Exponential Distribution: This distribution is used to model the time between events in a Poisson process. It is characterized by its rate parameter, which describes the average rate at which events occur.
- Uniform Distribution: In a uniform distribution, all outcomes are equally likely within a given range. It can be discrete (finite number of outcomes) or continuous (infinite number of outcomes within an interval).
Applications in Data Science
- Modeling and Simulation: Probability distributions are essential in simulations and modeling. For example, they can model customer behavior, financial markets, or supply chain processes. By simulating data using different distributions, data scientists can predict outcomes and evaluate risks.
- Statistical Inference: Understanding probability distributions allows data scientists to make inferences about populations based on sample data. For instance, hypothesis testing and confidence intervals rely on the properties of probability distributions to draw conclusions about the broader population.
- Machine Learning Algorithms: Many machine learning algorithms, such as Gaussian Naive Bayes and Hidden Markov Models, are based on probability distributions. These algorithms leverage the properties of distributions to classify data, predict outcomes, and recognize patterns.
- Risk Assessment: In finance and insurance, probability distributions are used to assess risks and determine the likelihood of adverse events. For example, Value at Risk (VaR) measures the potential loss in value of an investment portfolio over a specified period, given a probability distribution of returns.
- Optimization: Probability distributions help in optimizing processes and decision-making. Techniques like Monte Carlo simulation use random sampling from probability distributions to estimate solutions and evaluate different scenarios.
Conclusion
Understanding probability distributions is crucial for data scientists as they provide the foundation for analyzing data, making predictions, and drawing meaningful conclusions. By mastering the key concepts and applications of these distributions, data scientists can enhance their analytical capabilities and drive better decision-making processes.


